
10 Year Land Movement Report
Ten years of your land's history. In one report. From space.
Land movement is often invisible until it's expensive - cracked foundations, a declined insurance claim, a stalled sale, or a price renegotiated after you've already committed. A LandSure report shows you what the ground has actually done for the past decade, so you find out before you buy, build, insure or sell - not after.

Why order a report
One report can save you from a very expensive mistake.
Land movement problems rarely show up on a standard building report or a drive-by. By the time they are visible, they are expensive. Here is what a LandSure report actually does for you.
What a report does for you
A measured record for your engineer
Buying a property? Give the report to a geotechnical engineer or your adviser. It gives them a dated, measured record to start from.
Know before you commit
A report from $345 shows what the satellite has measured on and around the property, so you can ask the right questions while it is still easy to act.
A dated record
The report is dated and lists every measured point, so you and your advisers can see exactly what was measured and when.
Please read before you buy. LandSure is not a geotechnical engineer, and this report is not a geotechnical assessment, certification or a professional opinion. It is a record of how measured surfaces have moved, made from satellite data. It is meant to be used alongside your local geotechnical engineer, who knows your area and the differences in the land. InSAR does not work equally well in all land types, so please check that this product is right for you before purchasing.
What does a LandSure report actually look like?
The sample report runs to 36 pages: a two-page summary, how to read the report, every measured point on its own card, the street around the property, and the land, title and area records behind it.
Report Highlighted Pages
Real pages from an Edition 3 LandSure report on a Whangārei property, with the address and title withheld. Report length depends on how many measured points your property has.
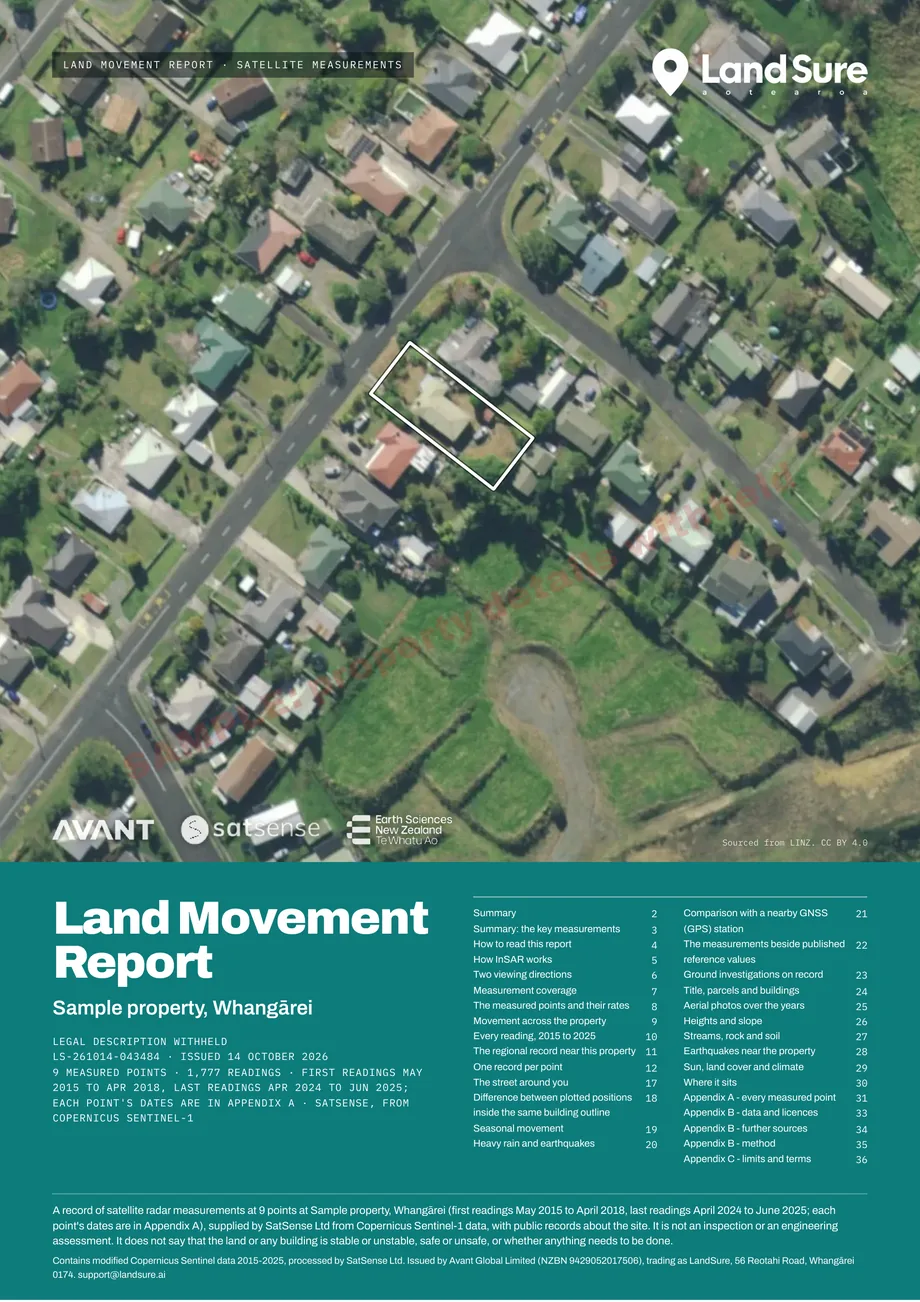
Cover - the property on LINZ aerial imagery, the measurement period and the contents.
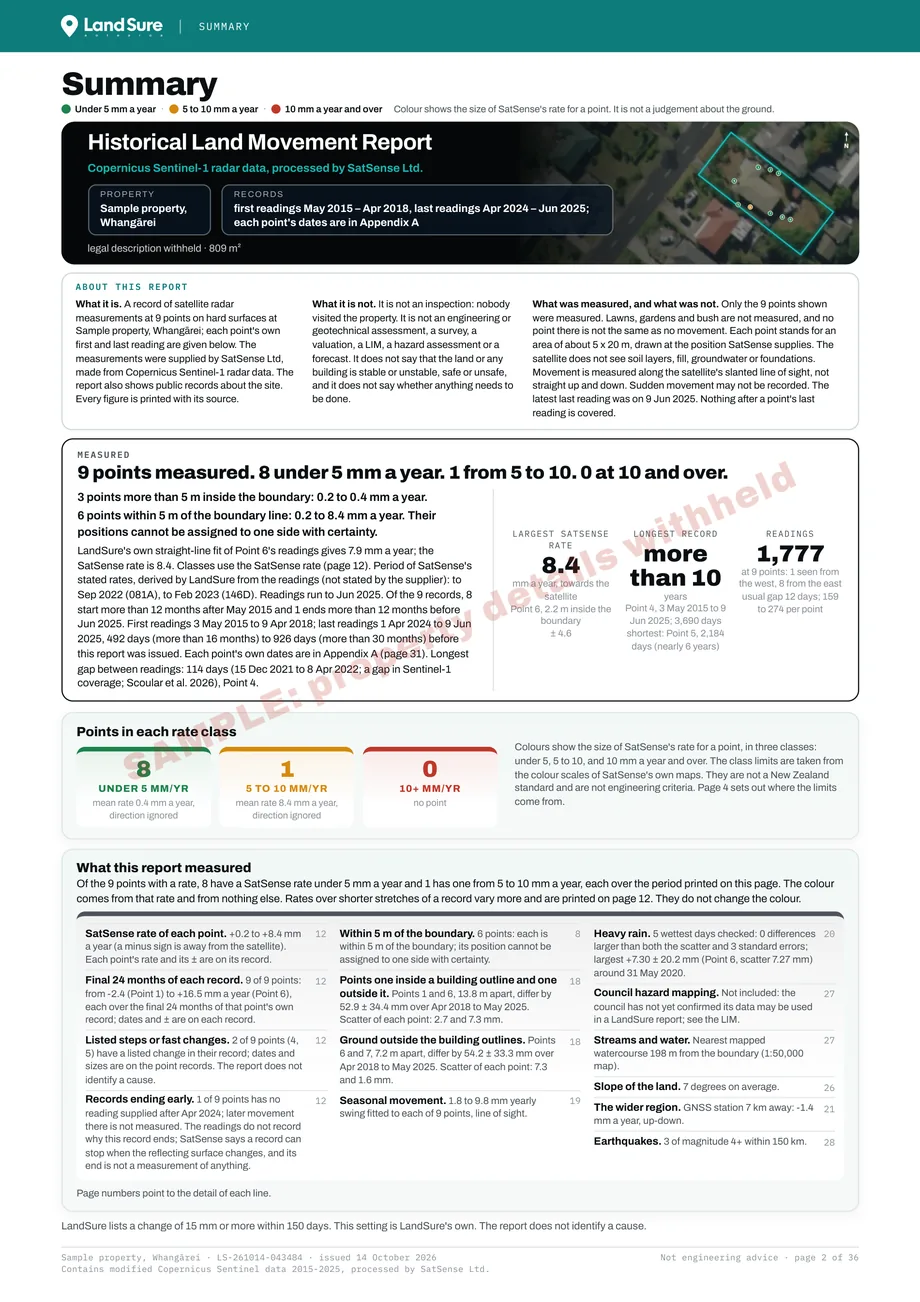
Summary - the property overview, the measured points and their rates, the points in each rate class and a check-by-check list with page numbers to the detail.
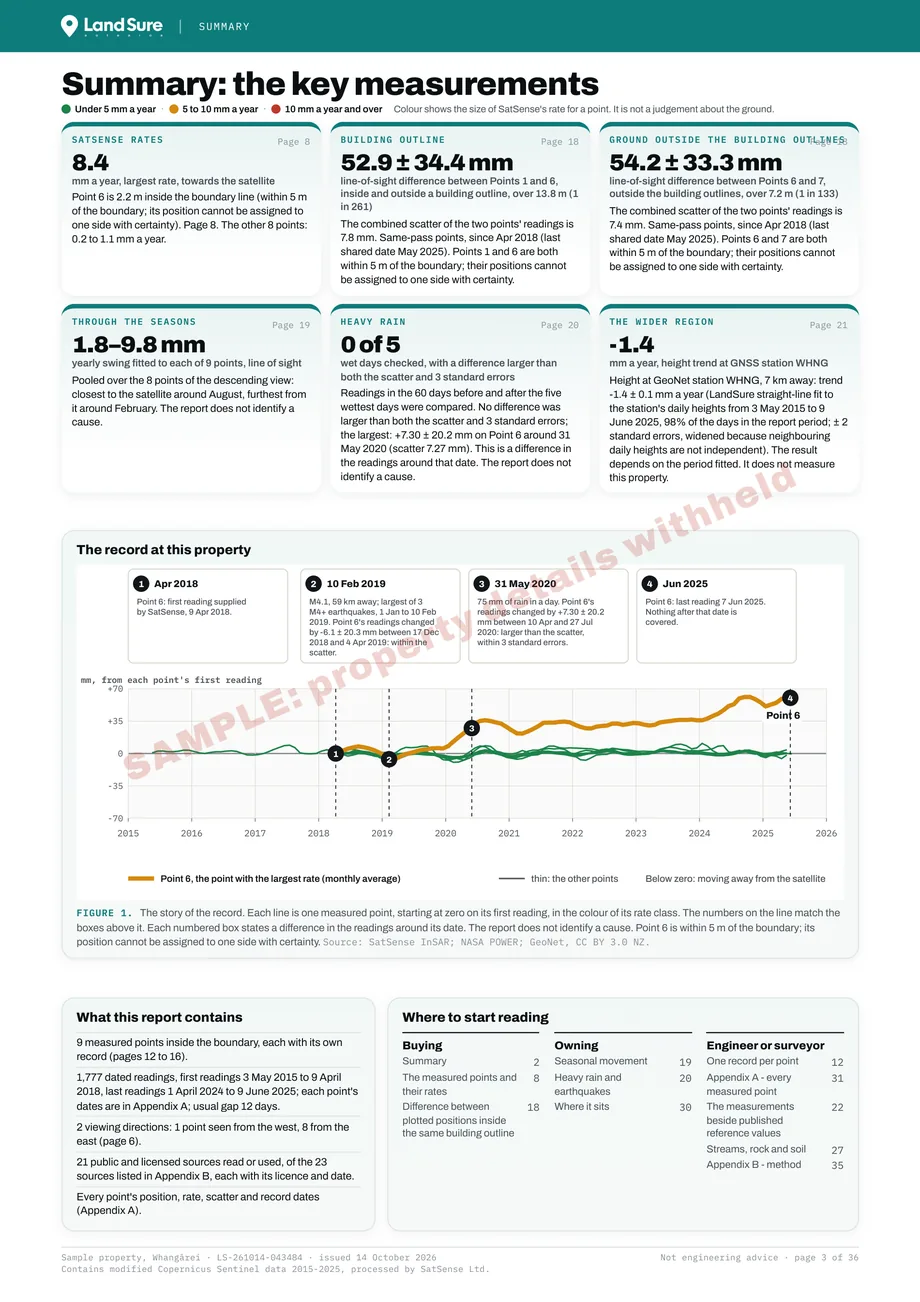
Summary: the key measurements - the largest rate, the difference between points on the house and the ground, the seasons, heavy rain and the nearest GNSS station, with a chart of the record.
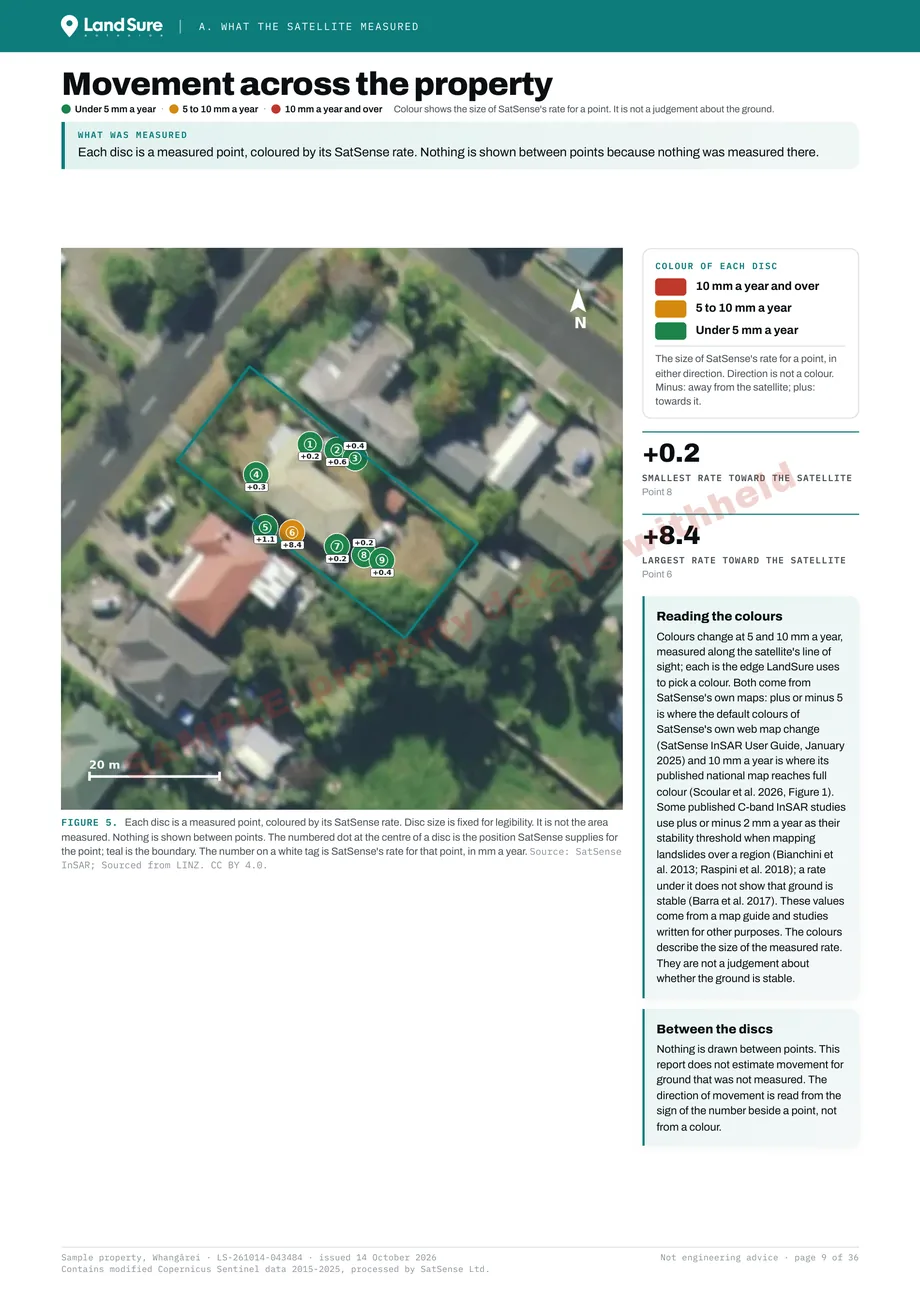
Movement across the property - each measured point shown as a disc over the aerial photo, coloured by its rate. Nothing is shown between points, because nothing was measured there.
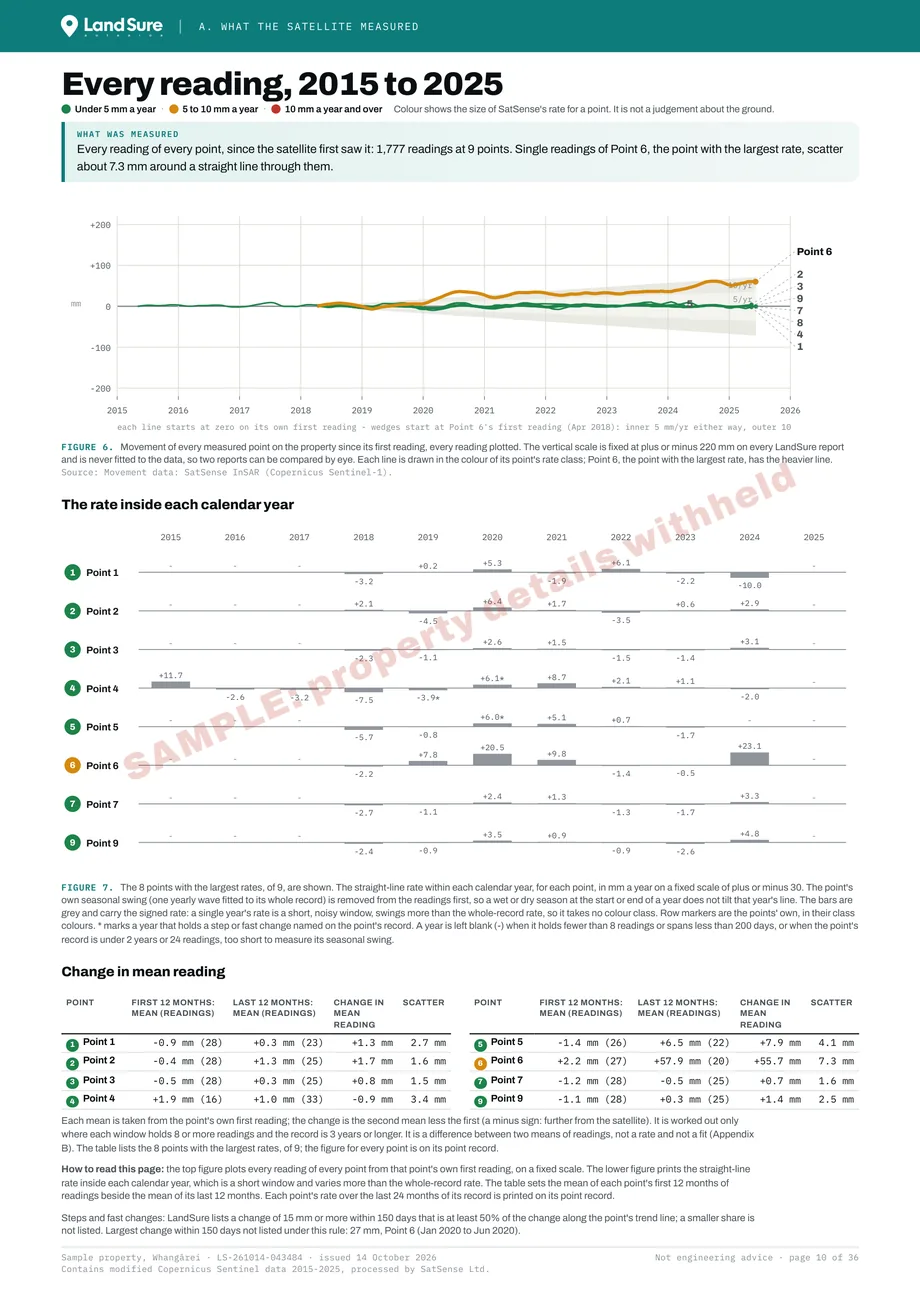
Every reading - every reading of every measured point on one fixed scale, from the first reading to the last.
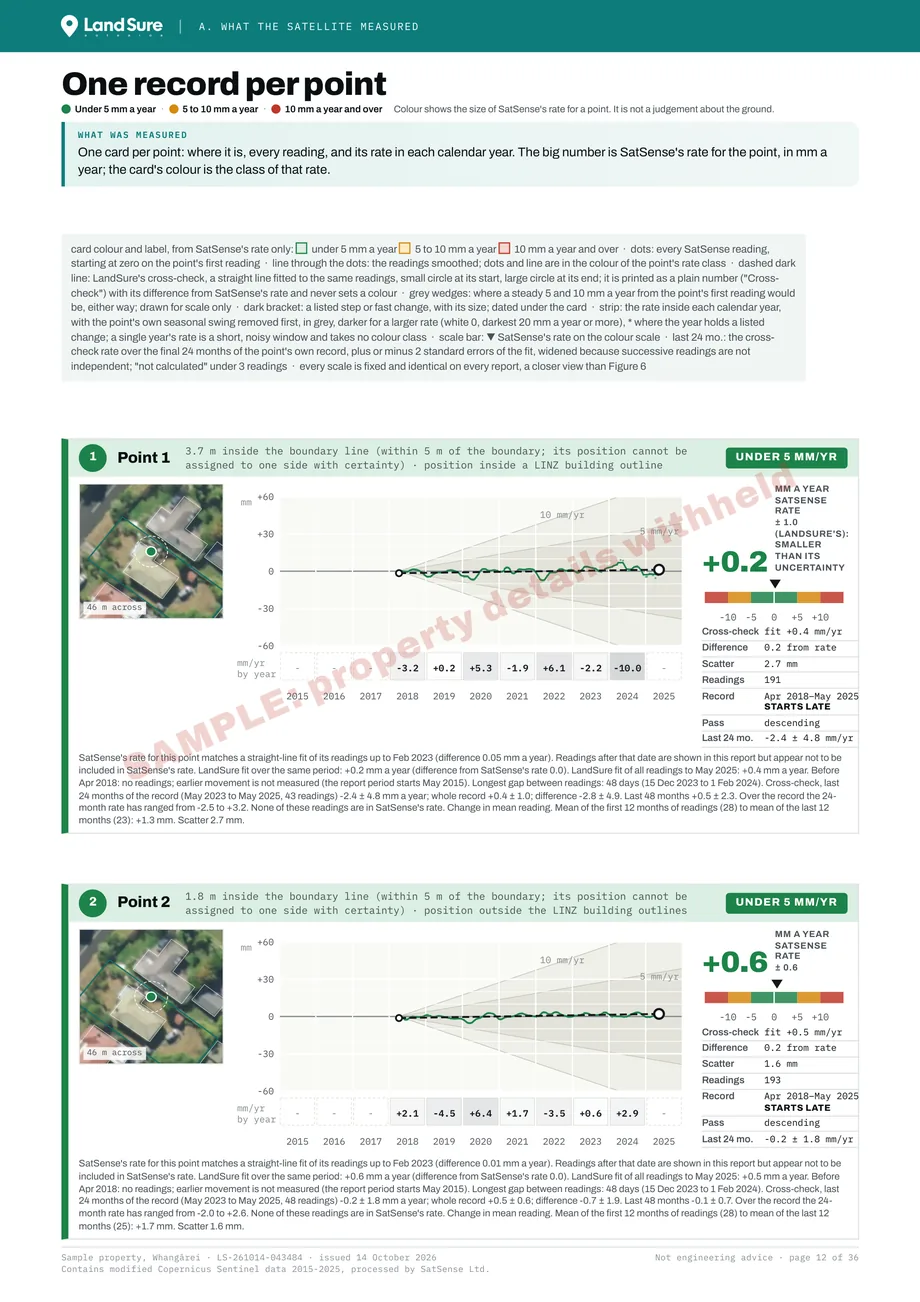
One record per point - a card for each point: where it is, every reading, and its rate in each calendar year.
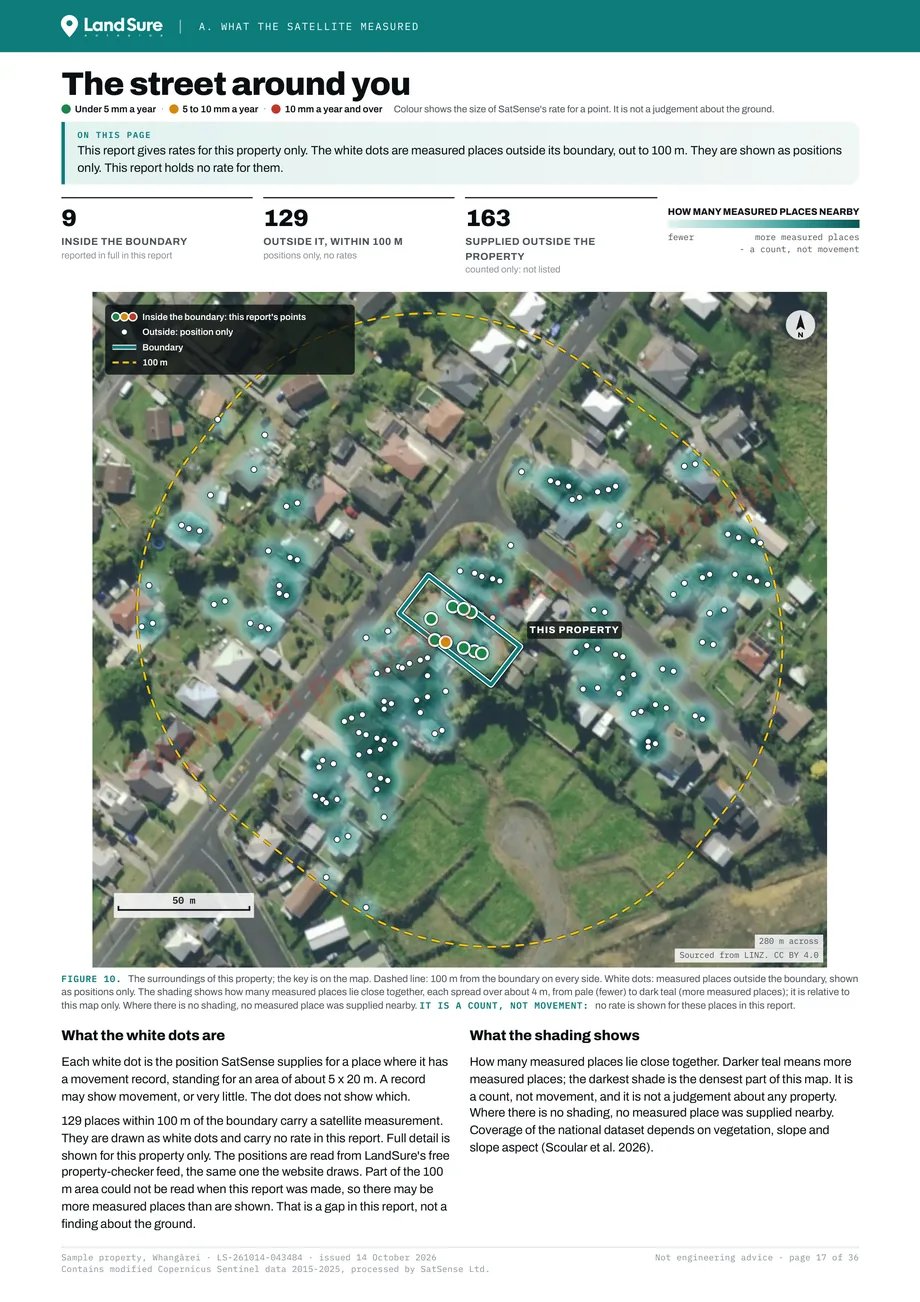
The street around you - full detail for the property only; out to 100 m, the positions of other measured places. Positions only: this report holds no rate for them.
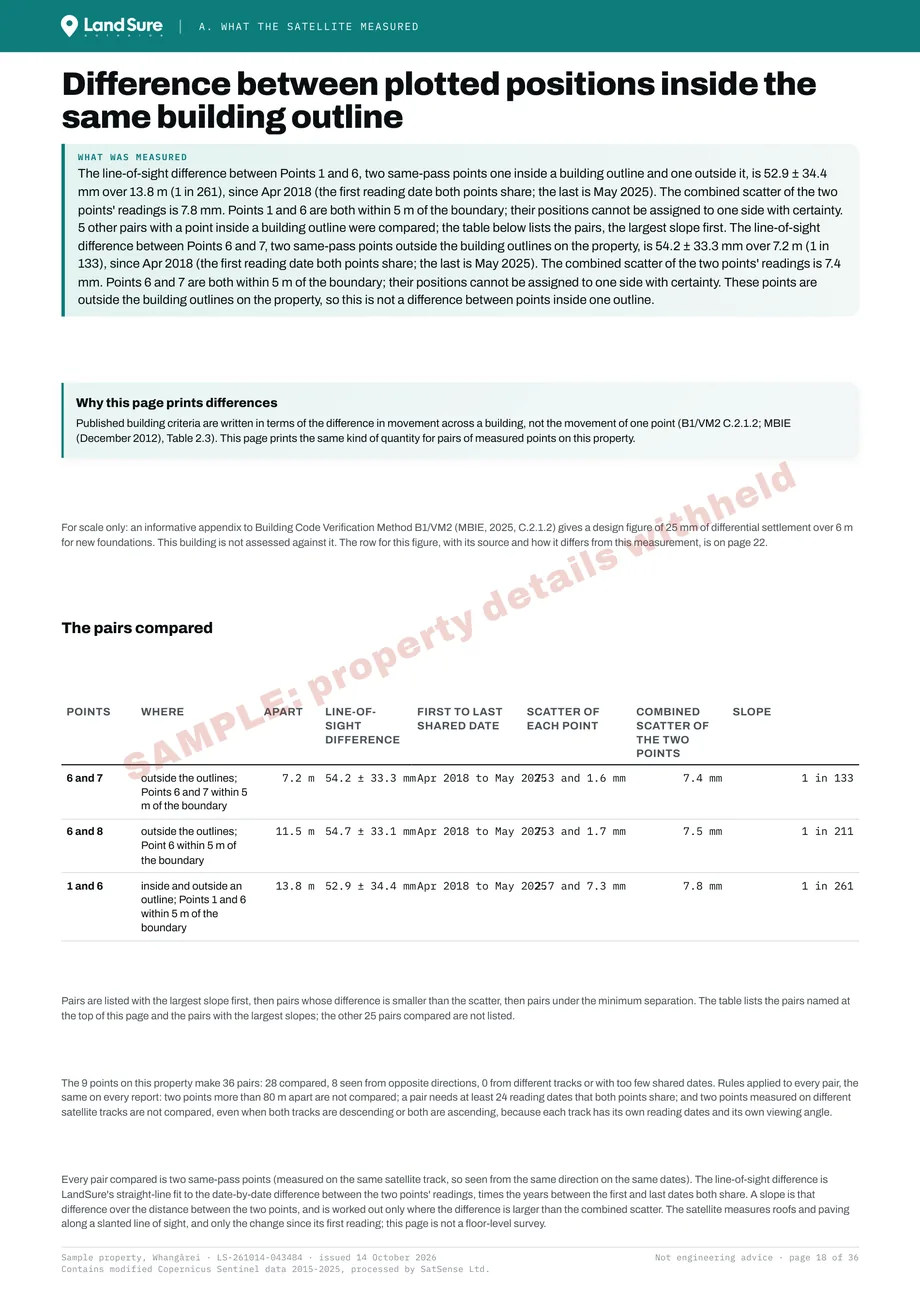
Difference between points on the same building - the line-of-sight difference between pairs of points on the house and the ground beside it, with the figure the Building Code verification method gives for scale.
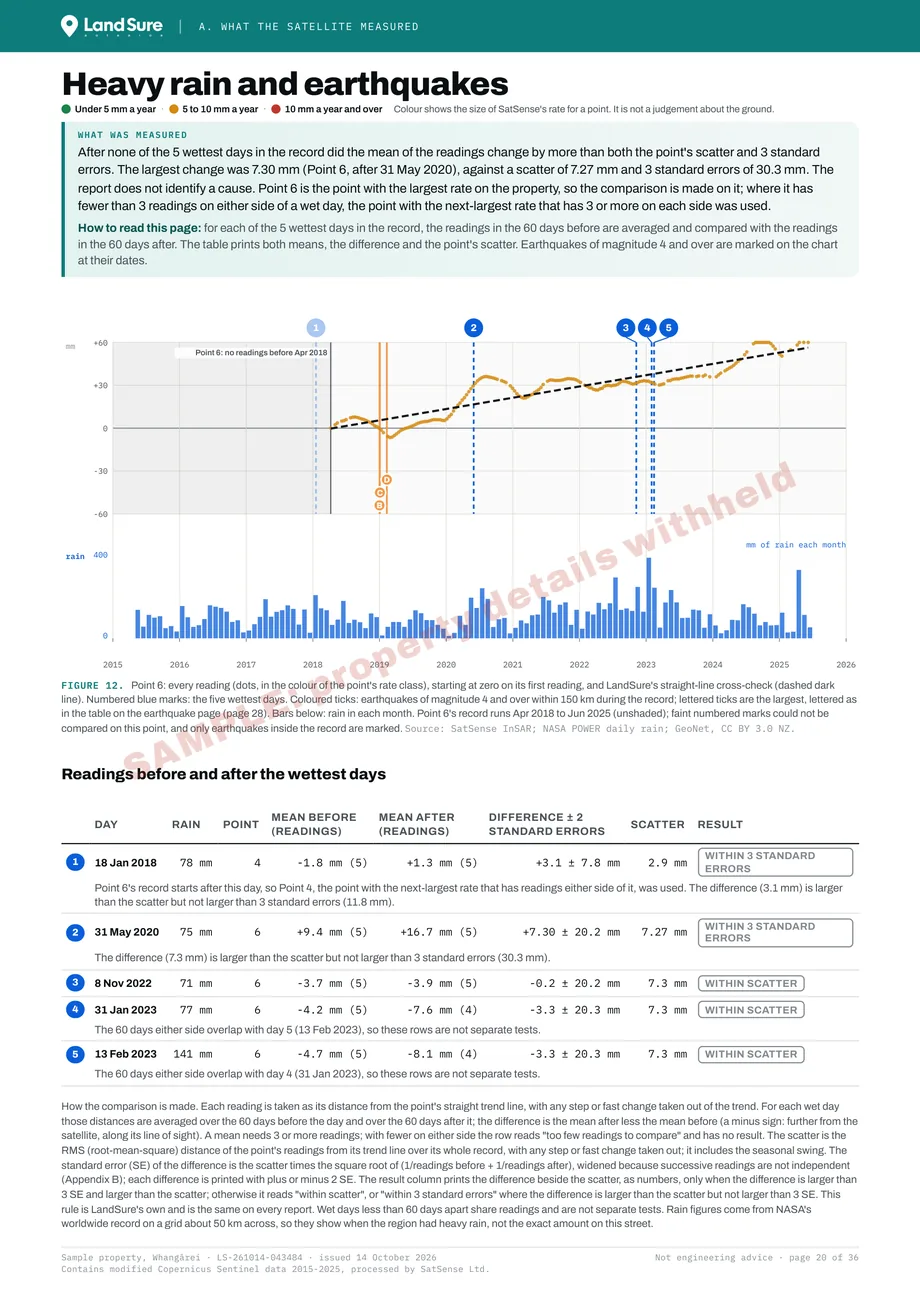
Heavy rain and earthquakes - whether the readings of the point with the largest rate changed after the five wettest days, with earthquakes of magnitude 4 and over within 150 km marked.
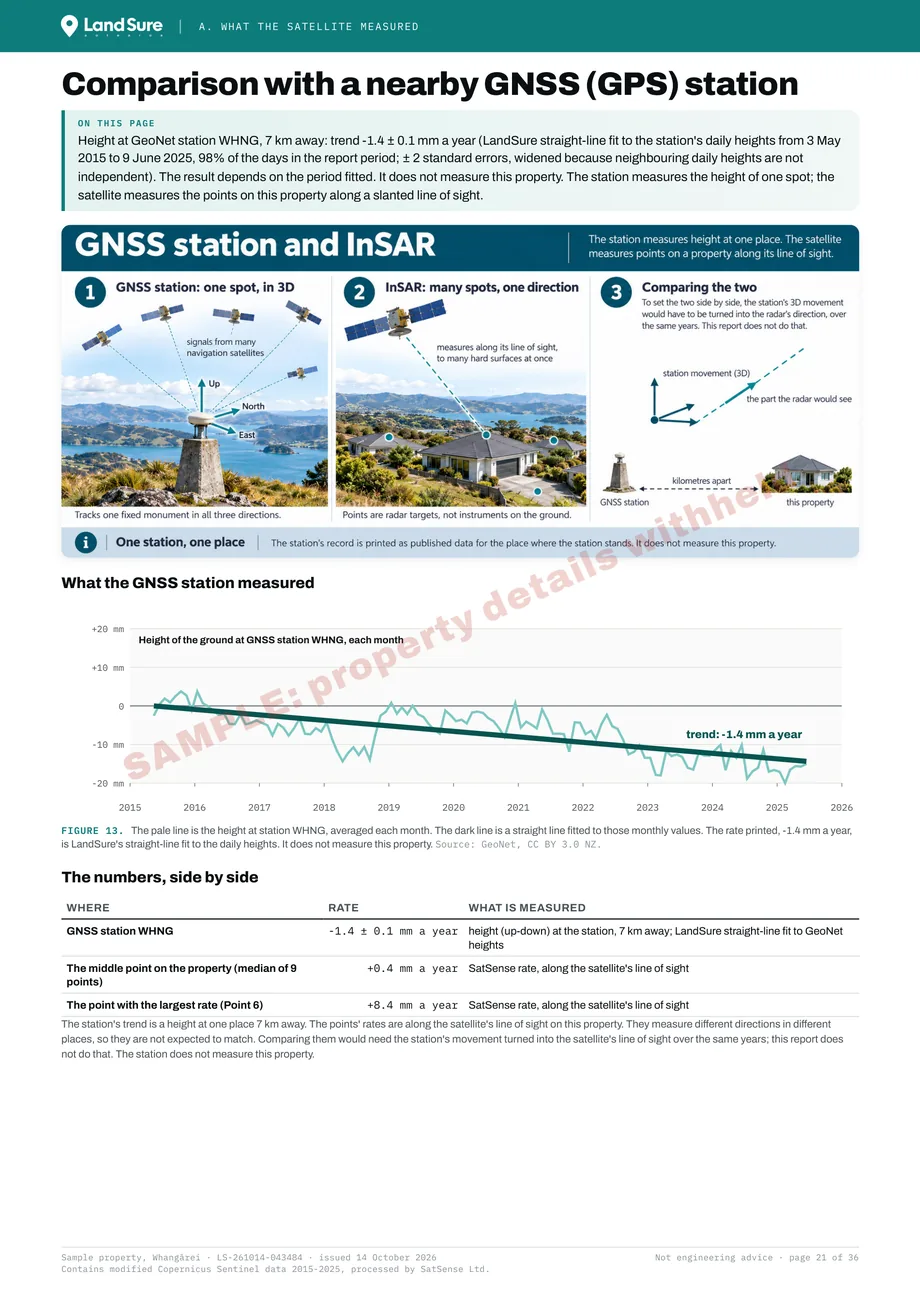
Comparison with a nearby GNSS (GPS) station - what the wider region is doing. Regional context, not a second measurement of your property.
Why this matters in New Zealand
New Zealand land doesn't stand still. Most of the time, you can't see it moving.
New Zealand sits on the boundary of the Pacific and Australian tectonic plates. The land is compressed, lifted, sheared and stretched continuously - and it doesn't announce itself until something fails.
Heavy rainfall can saturate slopes and trigger slips. InSAR can record slow hillside creep; it does not capture sudden failures.
The ground beneath a property sinks over time - due to drainage, tree roots, or underlying geology. Foundations crack. Driveways drop.
Auckland, Wellington, Kaikoura, Napier. Interseismic deformation accumulates slowly across NZ's fault zones. InSAR measures that background movement; it cannot predict when a fault will rupture.
Properties near the NZ coastline sit on ground that can creep, slump and settle. Our report measures that ground movement. It does not measure shoreline or cliff-edge retreat - we do not offer coastal erosion reporting yet, so contact us if you need erosion data.
The central North Island bulges and subsides with changes to magma bodies underground. InSAR measures that slow, wide-area movement from orbit.
Sources: NIWA and University of Auckland (2023); Earth Sciences New Zealand (2025).
We'll be straightforward about what this technology can and can't do.
InSAR is not magic. It is a precise measurement tool with real capabilities and real constraints. Here is a straightforward, traffic-light view of where it excels, where it needs care, and where it is not the right tool.
InSAR is great at
- Urban and suburban environments - buildings, roads and structures give excellent radar returns
- Slow movement detection - gradual subsidence, creeping slopes and long-term settlement are exactly what InSAR is built for
- Large-area screening - quickly identifies movement hotspots across whole properties or corridors
- Historical trend analysis - 10+ years of data reveals patterns fieldwork would take years to establish
- Post-event assessment - comparing pre- and post-event movement gives objective dated evidence
- Stable, open terrain - exposed rock, dry ground and paved surfaces return strong signals
InSAR still works, with care
- Dense native vegetation - bush and tree cover scatters the radar signal, reducing reliable points in forested areas
- Steep terrain - very steep slopes change the signal geometry and can create shadow zones behind ridgelines
- Active earthworks or construction - significant surface change between passes can cause signal loss until the surface stabilises
InSAR is not good when
- Movement is very rapid or sudden - the 12-day satellite cycle means a sudden large landslide may not be captured until the next pass
- Standing water is present - flat water returns very little signal, so wetlands or flooded areas may have few or no points
InSAR data does not replace a geotechnical engineer. It gives your geotechnical engineer up to ten years of history to start from.
Where our report indicates movement, elevated risk or uncertainty - we will say so. Where a finding needs a professional to look at it, the report says so beside that finding. We report what the data shows, whichever way it points.
Add to this report
Public records for the same property.
Bought in the same payment as a Land Movement Report for the same property, Property and Planning Records is $49, and Rural Land and Water Records is $149 for a block up to 50 ha. Each can also be bought on its own.